Figure 6.
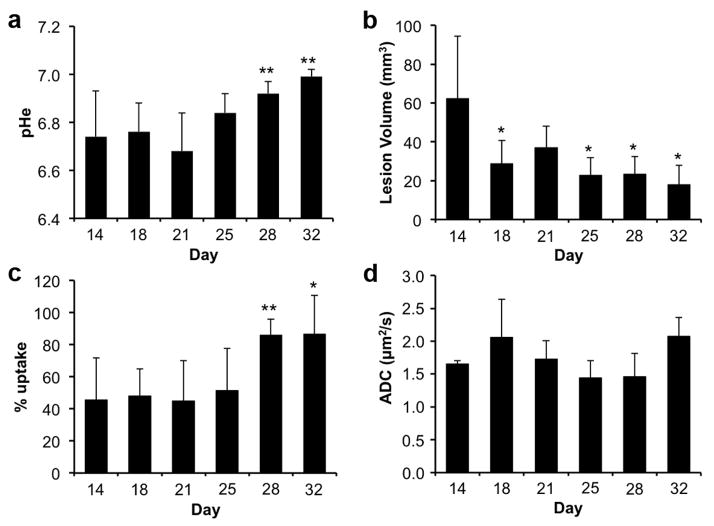
Longitudinal assessments of lung lesions. a The average pHe, b average lesion volume, c average % uptake of the agent, and d average ADC value of each group of mice are shown for each day. Error bars represent the standard deviations of the average for each group. Statistically significant differences relative to a measurement on Day 14 are indicated with an asterisk (* p<0.05, ** p< 0.01).

