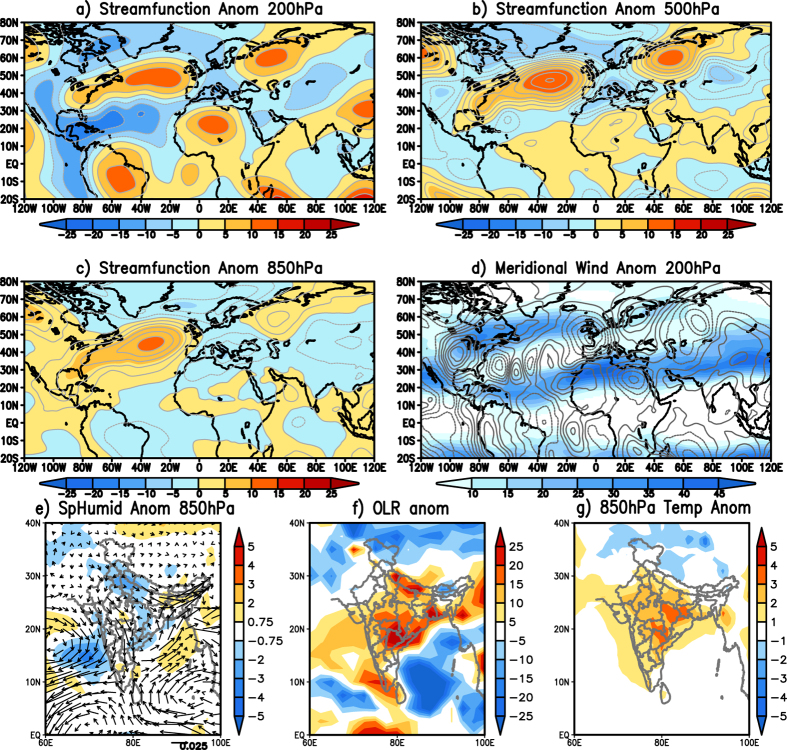
Figure 5.
(a) Eddy streamfunction (×106 m2s−1) anomalies at 200hPa averaged over 21st May2015 to 31 May 2015. (b,c) same as (a) but at 500 hPa and 850 hPa respectively. (d) 200 hPa meridional wind anomalies (contour) and zonal wind (shaded) averaged over 21st May 2015 to 31st May 2015. (e) same as (d) but 850 hPa specific humidity (Kg/Kg) anomalies (shaded) and moisture flux (kg m−1s−1) anomalies (vector). (f,g) same as (d) but OLR and 850 hPa temperature anomalies respectively. (Figure was created using a free software Grid Analysis and Display System (GrADS) version 2.1.a3 (http://cola.gmu.edu/grads/downloads.php).

