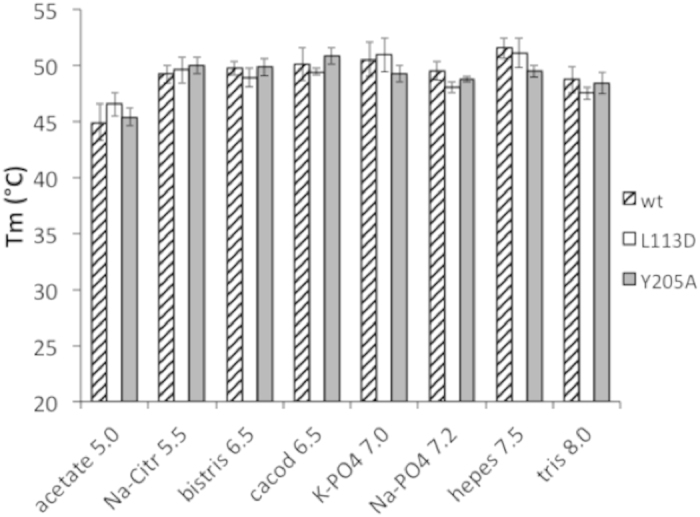
Figure 4. Melting temperature profiles of PhoP and its mutants. The buffers have a 100 mM concentration with the given pH, and they were adjusted with NaOH or HCl.

Each buffer also contains 100 mM NaCl and 5 mM MgCl2. Error bars represent the standard deviations of 3–5 measurements. Melting temperatures of the PhoP wild type (wt) and the L113D and Y205A mutants were measured by Thermofluor as described in the text.
