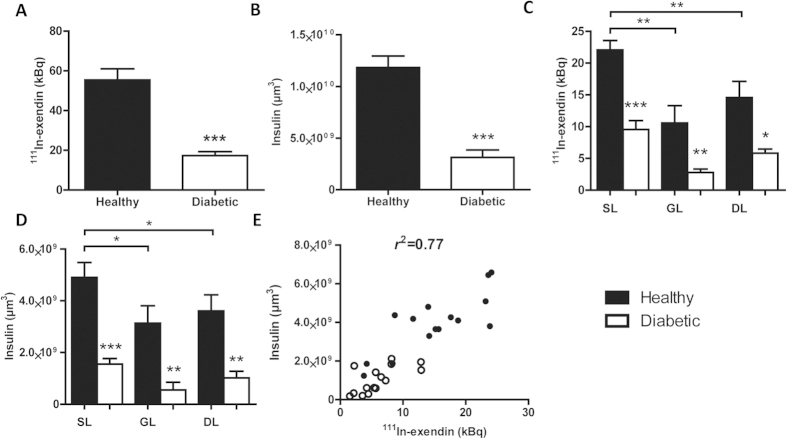
Figure 3. SPECT based radioactive quantification of 111In-exendin-3 uptake correlates with OPT based quantification of insulin positive β-cell volume.
(A,B) Quantification of absolute 111In-exendin-3 uptake (kBq) by SPECT (A) and total β-cell volume (μm3) by OPT (B) (n = 5). (C,D) Graphs illustrating the heterogeneous distribution of β-cells between the splenic, gastric (GL) and duodenal lobes (DL) as determined by SPECT (C) and OPT (D) respectively (n = 4–5). (E) Graph showing pancreatic uptake of 111In-exendin-3 by separate lobes plotted against β-cell volume shows a strong correlation (r2 = 0.77, p = 2.07 × 10⁻¹⁰). In (A–E) untreated rats are shown in black and alloxan-treated rats are shown in white. Data are shown as means ± SEM, where *p < 0.05, **p < 0.01 and ***p < 0.001 compared with the corresponding healthy group.

