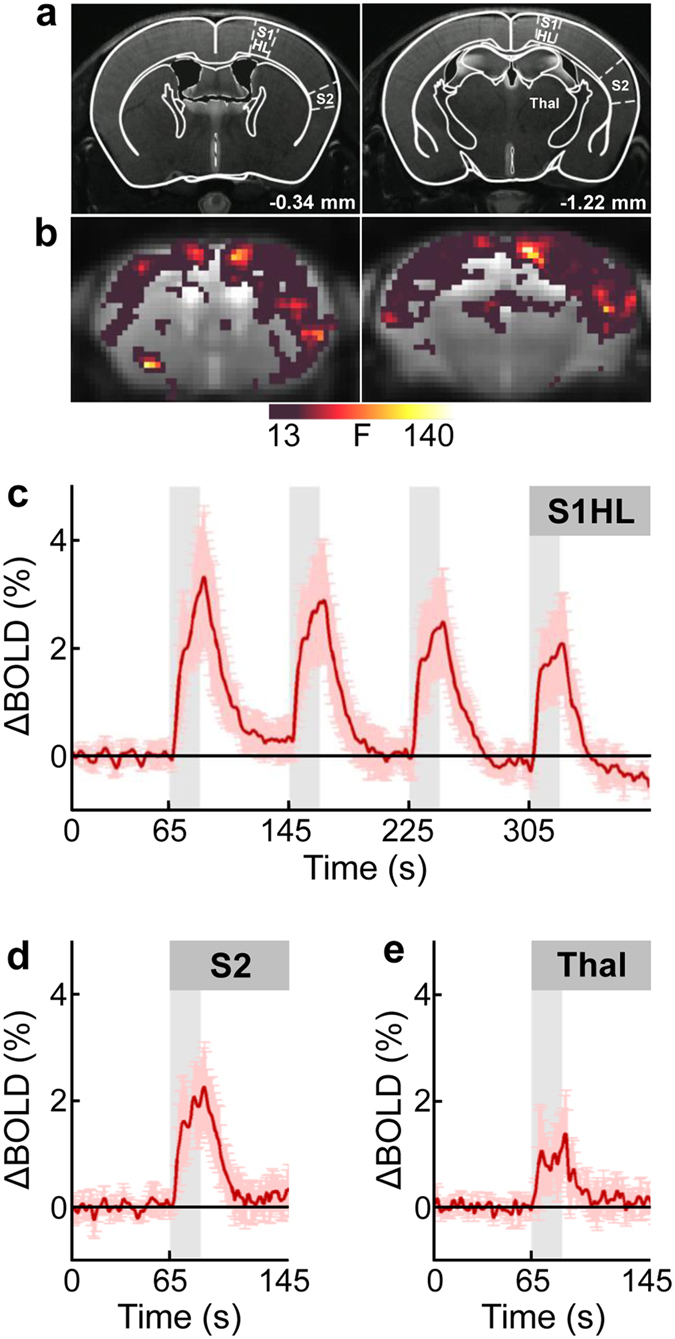
Figure 4. BOLD fMRI of neural activation elicited by unilateral electrical hindpaw stimulation in etomidate-anesthetized C57BL/6J mice.

(a) Mouse brain atlas superimposed on T2-weighted anatomical images with distances to bregma indicated. Regions of interest are outlined in the hemisphere contralateral to the stimulated hindpaw. (b) Statistical parametric maps of two brain sections, located at −0.34 mm and −1.22 mm relative to bregma, showing neural activation pattern upon electrical stimulation (2 mA, 5 Hz). The strongest stimulus-induced activation was observed both in ipsi- and contralateral hemisphere S1HL and S2 cortices, and Thal. The color bar represents F-values (F = 13 corresponds to p < 0.05, family-wise error rate (FWER) corrected with minimum cluster size ≥20 voxels). (c) Time course of BOLD signal change (∆BOLD; in percent of baseline values) in contralateral S1HL during the four stimulation periods of 20 s duration each (gray bars). (d,e) ∆BOLD (shown for the first stimulus period only) in contralateral (d) S2 and (e) Thal illustrating region-specific activation strength. Data are depicted as mean ± standard deviation for n = 5 animals. BOLD, blood oxygenation level dependent; S1HL, primary somatosensory hindlimb cortex; S2, secondary somatosensory cortex; Thal, thalamus.
