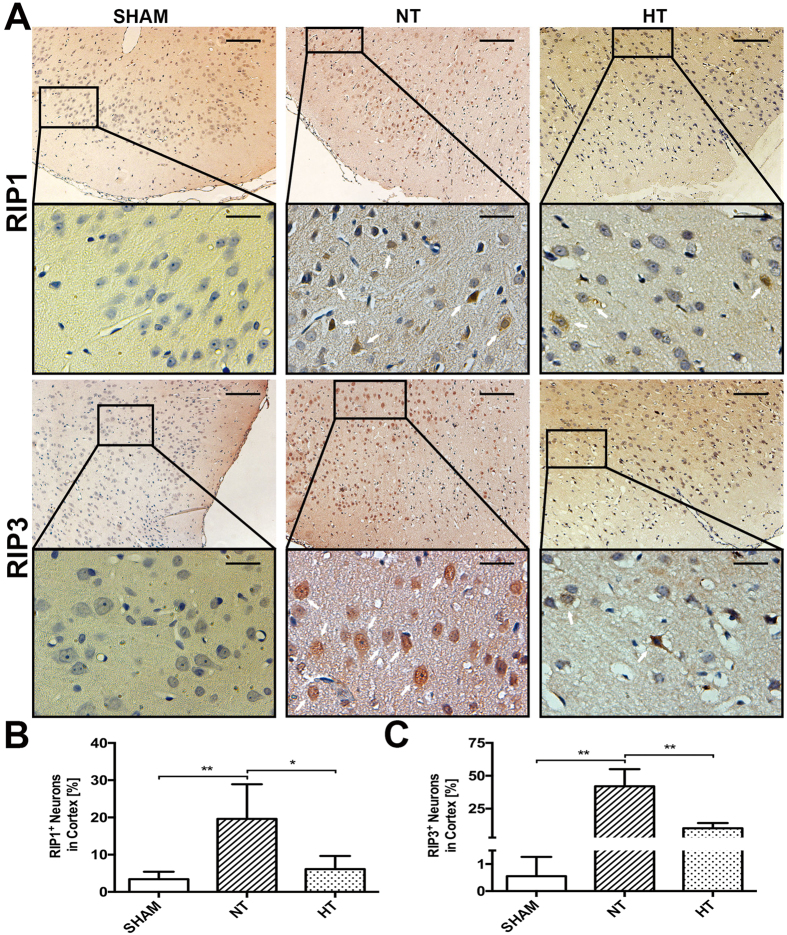
Figure 3. Characterization of RIP1 and RIP3 expression in cortical neurons.
Rats were sacrificed at 6 h after TBI. The brains of SHAM, TBI-Normothermia (NT) and TBI-Hypothermia (HT) were obtained. (A) Representative photographs of immunostaining for RIP1 and RIP3 in the cortex are shown (white arrows indicate immunoreactivity positive neurons). Original magnification ×100, magnification ×400 for interest area, the scale bars represented 200 μm and 50 μm respectively. (B) Statistical analysis of RIP1+ and RIP3+ neurons in the respective group (n = 6); Data are expressed as mean ± SD. *p < 0.05; **P < 0.01.

