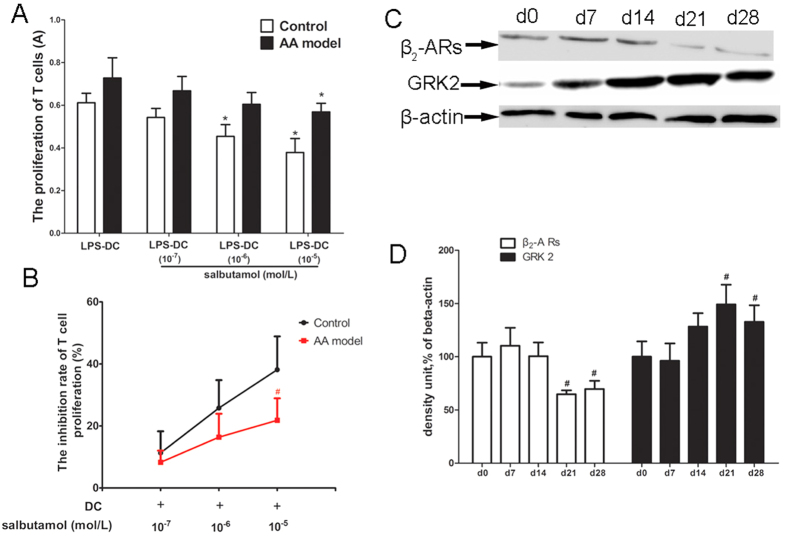
Figure 5. β2-AR signaling is weaker in BMDCs from AA rats than in BMDCs from control rats.
(A) The effect of salbutamol on MLR of BMDCs from control and AA rats. BMDCs generated from control (non AA) and AA rats were treated with salbutamol (10−5, 10−6, or 10−7 mol/l) ex vivo. Proliferation was measured by CCK-8 assay. *P < 0.05, compared with (LPS-DC) group. (B) T cell proliferation inhibition rate were analyzed. Data are shown as the mean ± SD for 6 animals in the AA and control groups, #P < 0.05, compared with control group. (C) The expression of β2-AR and GRK2 in BMDCs collected on d0, d7, d14, d21, and d28 from AA rats. (D) Densitometric analysis of the above immunoblots in bar chart form. Data are expressed as the mean ± SD for 3 animals in each group. #P < 0.05 vs d0 control.

