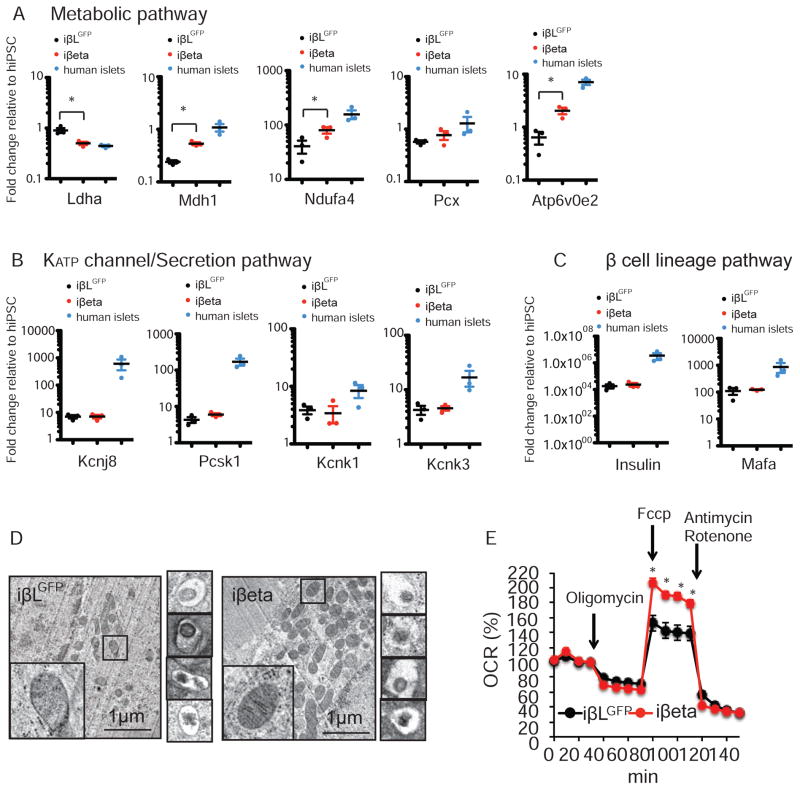
Figure 5. ERRγ regulates oxidative capacity through metabolic gene expression inβ-like cells.
(A–C) Relative expression of metabolic (A), KATP channel related (B) and β cell lineage genes (C) in iβLGFP cells, iβeta cells and human islets, as determined by qPCR (n=3). (D) Electron microscopy images showing mitochondrial morphology (left panel) and crystallized insulin granules (right panels) in iβLGFP and iβeta cells, respectively. (E) Oxidative capacity of iβLGFP and iβeta cells, as measured by oxygen consumption rate (OCR). *p<0.05 Student’s unpaired t-test.

