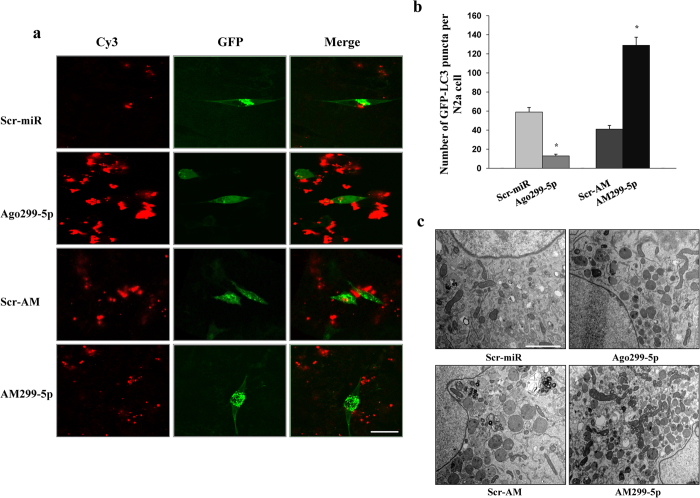
Figure 3. Assessment of autophagy in miR-299-5p (Ago299-5p) or antagomiR-299-5p (AM299-5p)-overexpressing cells.
(a) Cy3-labeled Ago299-5p blocked GFP-LC3 puncta formation, and AM299-5p promoted puncta formation in Neuro-2a cells (n = 100). Scale bar = 25 μm. (b) Quantitative analysis of the experiments in panel (a) (mean ± SD of independent experiments, n = 4, *p < 0.05). (c) Representative TEM images of AVs in control and miR-299-5p/AM299-5p-overexpressing primary hippocampal neurons from AD mice. Scale bar = 2 μm.

