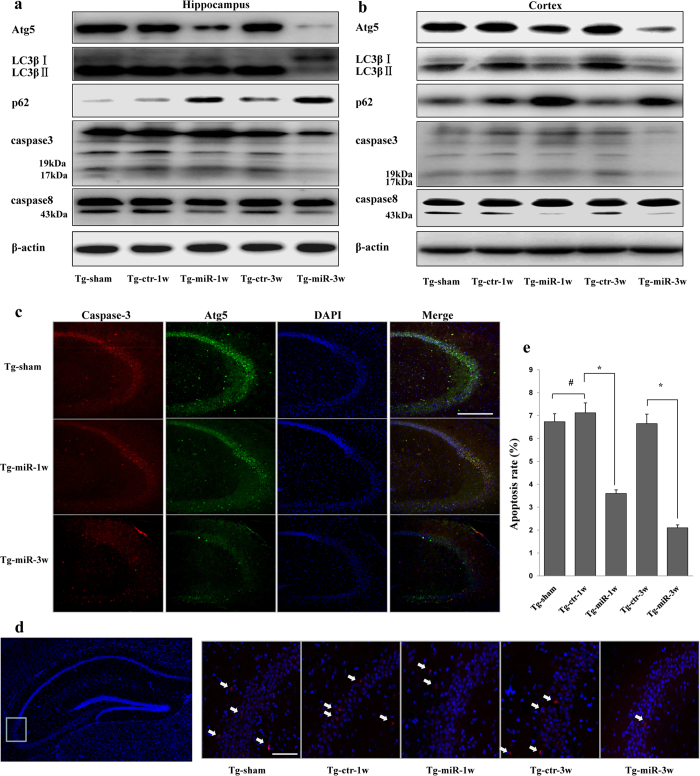
Figure 6. Therapeutic effects on protein levels.
(a) The alteration of protein levels in the hippocampus after treatment with Ago299-5p (n = 5 per group). (b) The alteration of protein levels in cortex after treatment with Ago299-5p (n = 5 per group). (c) The fluorescence intensity of cleaved caspase-3 in the hippocampus was weakened with the decreasing intensity of Atg5 after treatment with Ago299-5p (n = 5 per group). Scale bar = 250 μm. (d) Apoptosis examination was performed by TUNEL assay, TUNEL positive cells were marked with arrows. Scale bar = 50 μm. Representative TUNEL assay images were captured from the boxed region. (e) The percentage of positive cells was calculated as the apoptosis rate (number of positive cells/total number of cells × 100%) (mean ± SD, n = 5 per group, *p < 0.05, #represents no significance).

