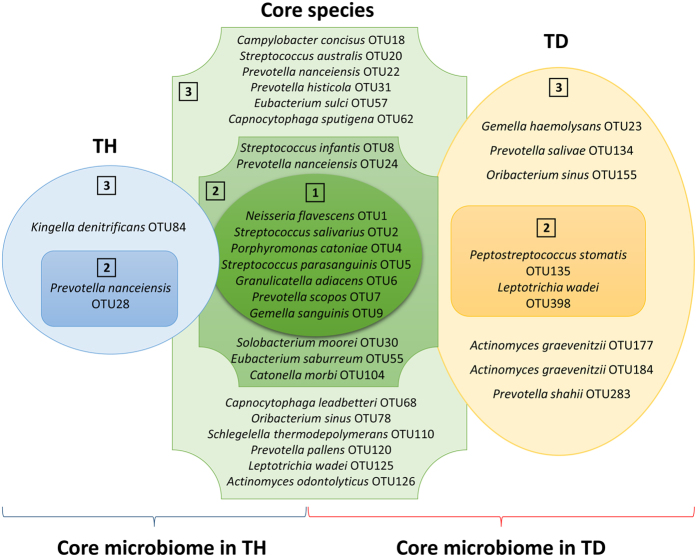
Figure 7. The core tongue coating microbiome and the health-associated and halitosis-associated tongue coating microbiomes.
Core microbiomes were defined as OTUs with prevalences above 75% in both the healthy and halitosis groups (green). Health-associated microbiomes were defined as OTUs with prevalences above 75% in the healthy tongue coating samples, but less than 75% in the halitosis tongue coating samples (blue). Conversely, halitosis-associated microbiomes were defined as OTUs with prevalences above 75% in the halitosis tongue coating samples, but less than 75% in the healthy tongue coating samples (orange). Prevalence and relative abundance were used for further filtering. Circles labelled with “1” contain OTUs that were present in all 19 subjects with a mean relative abundance of ≥1% of the total sequences. Circles labelled with “2” contain OTUs that were present in all healthy (dark blue) or halitosis samples (dark orange), but with low abundances (<1%). The outer circles labelled with “3” contain OTUs with greater than 75% but less than 100% prevalence in the healthy (light blue) and halitosis samples (light orange) with a mean relative abundance of <1%. TH: healthy tongue coating sample, TD: tongue coating sample with halitosis.

