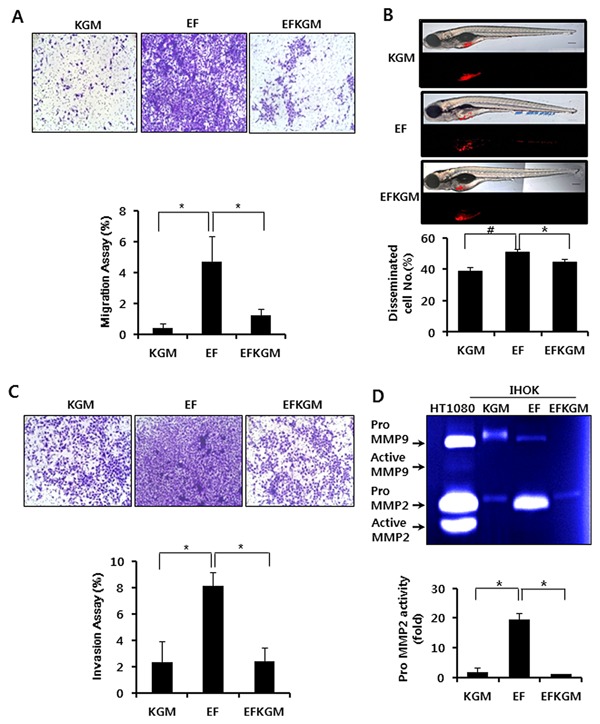
Figure 2.

Migratory and invasion activities of IHOKs grown in different culture conditions. (A) Each cell line was seeded on a transwell chamber, and the number of cells that migrated to the other side of the chamber was counted after 48 hr. In the lower chamber, each culture medium was applied as a chemoattractant. Each assay was performed in triplicate (*P < 0.05). (B) Transplanted embryos were incubated in E3 media without methylene blue at 31°C. Four days later, the number of embryos exhibiting cell dissemination was counted (24 larvae/group). Representative fluorescent images (bottom) and merged DIC: fluorescent images (top). Blue arrow indicates cell mass disseminated from the injection site (yolk sac). Bar=200 μm. Data are presented as average ± SD of six independent assays. Student‘s t‐test was used for comparison between experimental groups (# = P < 0.01, * = P < 0.05). (C) For invasion assay, each cell line was seeded on a transwell chamber that was pre‐coated with collagen type I. After 48h, the number of cells that invaded the collagen and moved to the other side of the chamber was counted (*P < 0.05). (D) Each cell line was incubated in its culture medium for 48P < hr. The conditioned media were collected and subjected to gelatin zymography. Gelatin zymography was performed using electrophoresis gels that contained 0.2% gelatin (*P < 0.05).
