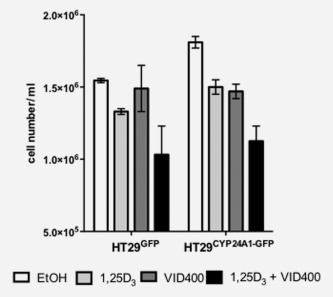
Figure 2.

Response of stably transfected cells to treatments of 1,25‐D3 and CYP24A1 inhibitor. Cell number was assessed after 14 days of treatment with 10 nM 1,25‐D3 in combination with the CYP24A1 inhibitor VID400 (200 nM). Bars, vehicle control (white bar), 10 nM 1,25D3 (light grey bar), 200 nM VID400 (dark grey bar) and combination of 1,25D3 with VID400 (black bar) represent mean ± SEM of two independent experiments in triplicates.
