Figure 5.

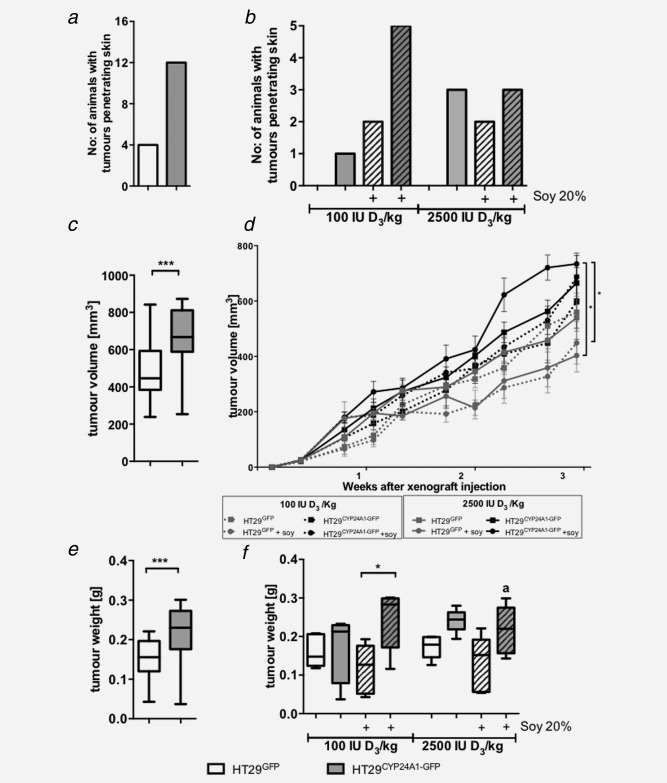
Tumour penetration, growth curve and weight of xenografts in male SCID mice. (a) Number of animals with tumours penetrating the skin; effect of CYP24A1 expression (n = 20 per group). (b) Tumour penetration per group (n = 5) at the end of the experiment. (c) Effect of CYP24A1 expression on tumour volume (n = 20 per group). Tumour volume was calculated using the formula (length × width2)/2. (d) Effect of diet on tumour volume per group (n = 5). HT29GFP xenografts: grey line, HT29CYP24A1 xenografts: black line, low vitamin D diet: dashed lines, high vitamin D diet: continuous lines, supplemented with soy: lines with circles, absence of soy: lines with squares. Area under the curve was used for the analysis. (e) Effect of CYP24A1 expression on tumour weight (n = 20 per group). (f) Tumour weight per group (n = 5) is shown in the different diet groups. As three out of five animals had bite marks on the tumours, the weight of CYP24A1 overexpressing tumours in the high vitamin D and soy group is lower than expected (a). Data points represent mean ± SEM. Patterned bars: diet containing 20% soy. Whiskers represent min to max. Statistical significance was determined using unpaired t‐test (a, c, e), area under the curve (d) and two‐way ANOVA with Tukey's multiple comparison (b, d, f), *p < 0.05, ***p < 0.001.
