
Figure 6.
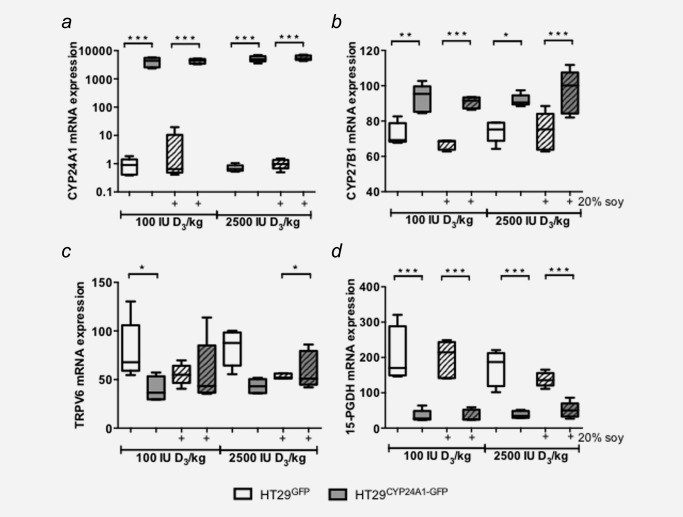
Expression of vitamin D system genes and vitamin D target genes in xenografts. mRNA levels were determined by qRT‐PCR as described in the methods section. (a) mRNA expression of the 1,25‐D3‐degrading enzyme CYP24A1. (b) mRNA expression of the 1,25‐D3‐activating enzyme CYP27B1. Expression of vitamin D target genes: (c) the calcium channel TRPV6, and (d) prostaglandin E2‐degrading enzyme 15‐PGDH. Patterned bars: diet containing 20% soy. Data were log transformed to achieve normal distribution and statistical analysis was performed using two‐way ANOVA with Tukey's multiple comparison, *p < 0.05, **p < 0.01, ***p < 0.001.