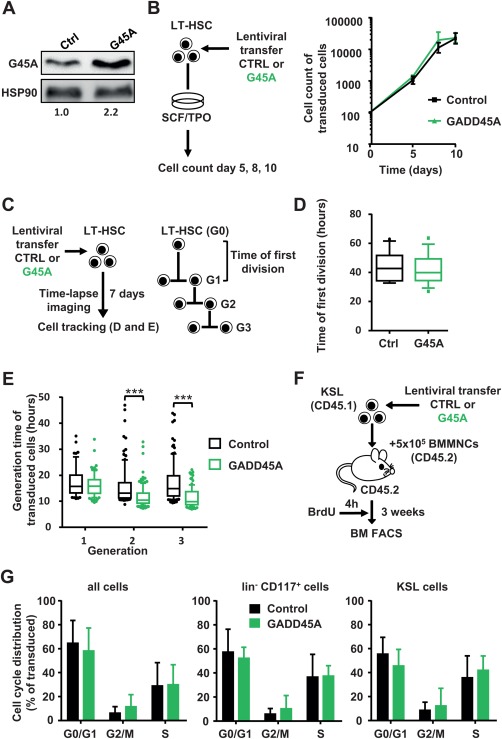
Figure 1.

GADD45A expression does not lead to a cell cycle arrest in HSCs and their progeny (A): Relative quantification of the GADD45A protein expression via immunoblot of KSL cells lentivirally transduced with GADD45A or control. The transduction efficiency was 91% and 86% for control and GADD45A‐transduced cells, respectively. (B): Experimental scheme and quantification of in vitro expansion of GADD45A expressing compared to control‐transduced LT‐HSCs. N = 3 individual experiments. Data represented as mean ± SD. (C): Experimental scheme of video‐microscopy based cell tracking of GADD45A‐ or control‐expressing LT‐HSCs and their progeny. Tracking results are shown as boxplots (box represents 25%–75% and the median with whiskers indicating 10%–90%, outliers are shown as dots) in (D) and (E). (D): The time of first division of 15 control and 14 GADD45A‐expressing LT‐HSCs. (E): Cell cycle length (generation time) in three subsequent generations. Data were generated using two independent experiments analyzing N = 265 cells for control and N = 313 cells for GADD45A. Only transduced cells (VENUS+) were included. Statistical significance was determined using the Mann‐Whitney test. (F): Experimental scheme of BrdU incorporation analysis after in vivo transplantation. (G): Cell cycle phases of all cells, lineage− CD117+ cells, and KSL cells in the bone marrow 3 weeks after transplantation are displayed. Only transduced (VENUS+) cells were included. N = 6 mice per group. Data represented as mean + SD. ***, p < .001. Abbreviations: BM, bone marrow; BMMNCs, bone marrow mononuclear cells, BrdU, bromodeoxyuridine; Ctrl, control; FACS, fluorescence activated cell sorting; G45A, GADD45A; G0‐3, generation 0‐3; LT‐HSC, long‐term repopulating hematopoietic stem cells; SCF, stem cell factor; TPO, thrombopoietin.
