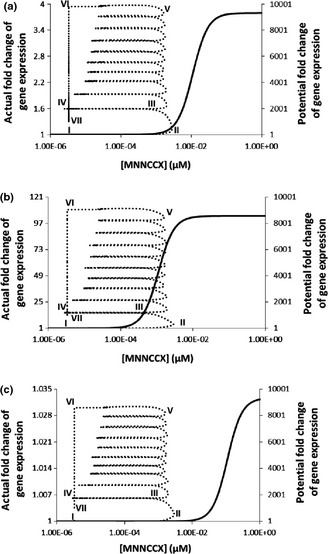
Figure 7.

Gene expression accumulates all information during the lifetime of the oscillatory calcium signature (Fig. 2a) for three binding affinities between the active complex 4Ca2+–CaM–CAMTA and DNA in Arabidopsis thaliana. Solid line (right y‐axis): potential fold change of gene expression if the concentration of 4Ca2+–CaM–CAMTA stays at each concentration sufficiently long that a steady‐state is established at each concentration. Dashed line (left y‐axis): actual fold change of gene expression for 10 cycles of Ca2+ oscillation (Fig. 2a). Binding affinity (K d) between the active complex 4Ca2+–CaM–CAMTA and DNA: (a) 1.1 × 10⁻² μM; (b) 1.1 × 10⁻³ μM; (c) 1.1 × 10⁻¹ μM. CAMTA, calmodulin‐binding transcription activator; CaM, calmodulin.
