Figure 1.

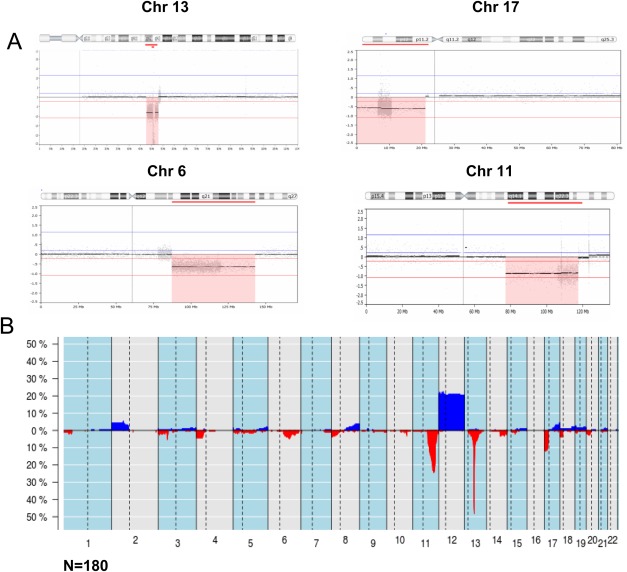
Whole‐genome overview of copy number alterations detected by qChip®Hemo array. (A) Chromosomal view of four altered regions highlighted with a red box. Probes for losses of 13q, 17p, 6q, and 11q14‐q23 are enriched in the array. Gray dots represent individual probes and the higher density of probes in these regions as compared with the backbone coverage can be observed. (B) Frequency plot of copy number alterations in 180 CLL patients. On the X‐axis the chromosomes are represented horizontally, on the Y‐axis the percentage of cases showing the copy number alterations (gains in blue, losses in red).
