
Figure 6.
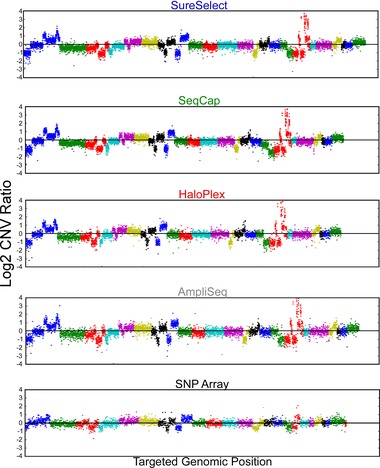
Global copy‐number variation. Global copy number (log2 ratio) for the HCC‐2218 cell line against its matched normal; HCC‐2218BL for all technologies and a conventional SNP array. For each technology, we plotted points with matching sequencing and SNP array copy‐number ratios, whereas for the SNP array, we plotted all log2 copy‐number ratios. Each color represents a different chromosome.