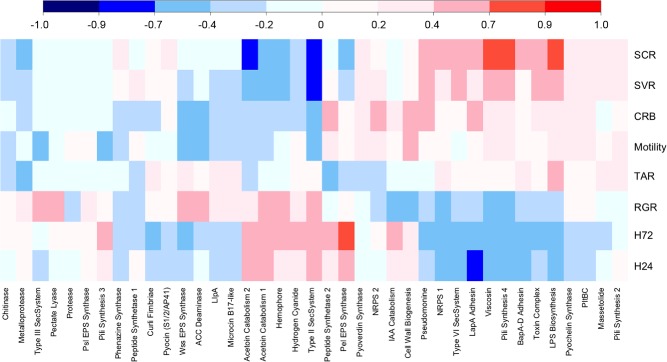
Figure 5.

‘Phenotype’ versus ‘phenotypic output gene’ correlation coefficient analysis: Spearman's rank correlation coefficients between the 10 measured bacterial phenotypes and the presence or absence of phenotypic output operons. Acronyms used for phenotypes are the same as described for Fig. 3. The scale range is from bright red (highly positively correlated) to dark blue (highly negatively correlated). Light colours represent low correlations.
