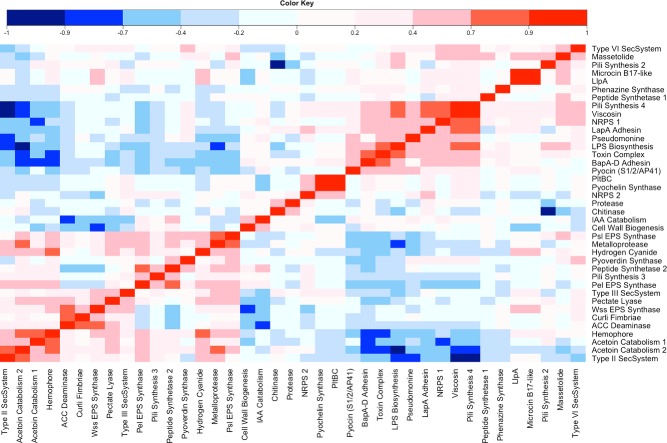
Figure 6.

‘Output gene’ versus ‘output gene’ correlation coefficient analysis: Spearman's rank correlation coefficients between the individual phenotypic output operons. The scale range is from dark blue (highly negatively correlated) to bright red (highly positively correlated), Light colours represent low correlations.
