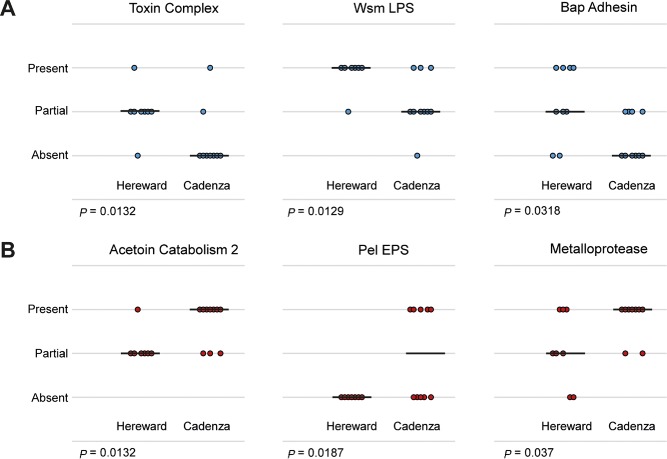
Figure 7.

Impact of first year wheat variety on the abundance of P seudomonas phenotypic output loci: Wilcoxon–Mann–Whitney tests to probe the genetic differences between strains isolated from the wheat varieties cultivated in year 1. Each dot represents 1 of the 19 P . fluorescens sequenced genomes interrogated for the presence or absence the phenotypic output operons noted in each case and is reported as present, partially present or absent. Operons that were significantly more abundant in first year Hereward plots are shown in blue (A), those that were more abundant with year 1 Cadenza in red (B). The two‐tailed P value from the Mann–Whitney test is reported beneath each box. For visibility purposes only, some noise was introduced to the positions of the points to avoid their superposition.
