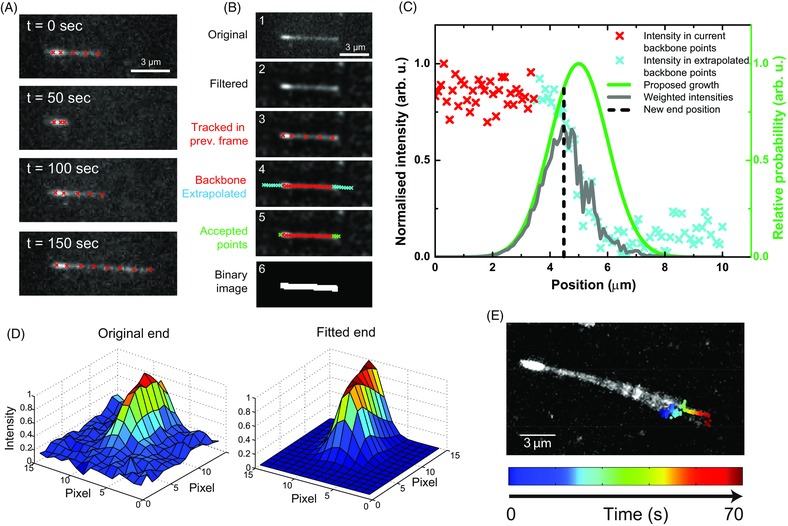
Figure 3.

Microtubule end tracking. (A) Time sequence of TIRF microscopy images of an experimental dynamic microtubule tracked over a long period; the number of fitted red points varies to follow changes in total microtubule length. (B) Illustration of the steps performed to identify pixels belonging to a microtubule in the current frame (see main text). (C) Schematic showing how a new end point is initially determined in the current frame, using extrapolated points based on the current backbone positions. A proposed growth function is used to weight the 1D intensity profile, based on experimental parameters and the current state of the predictive dynamic model. (D) A 2D least squares fit (right) to the original, unfiltered experimental data (left) is used to determine the microtubule end. The same fitting procedure, with a configurable parametric model, is carried out for each fitted point. (E) Example maximum intensity projection of a wiggling microtubule during a growth period; the coloured points show the end position found from the 2D fitting at each time point. This illustrates that a ‘wiggling’ microtubule end can be tracked reliably.
