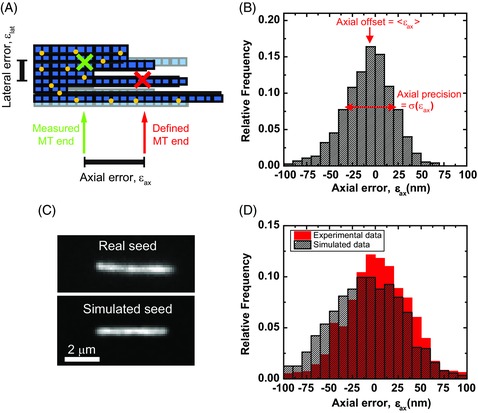
Figure 4.

Localization errors from tracking simulated and experimental static microtubule ends. (A) Schematic of a simulated microtubule end showing tubulin dimers (blue squares) labelled with fluorophores (yellow circles). The simulated end position is defined as the mean of the coordinates of the final subunit on each of the 13 protofilaments, independent of labelling state (red cross). The difference between this position and that found from tracking the final movie (an arbitrary example position is shown as a green cross) define the axial and lateral localization errors. (B) Representative histogram of the axial errors found from tracking simulated microtubules. The offset and precision are defined as the mean and standard deviation of the errors, respectively. (C) A TIRF microscopy image of an experimental static GMPCPP‐stabilized microtubule (top) and a corresponding image of a simulated static microtubule (bottom). (D) As B, with the results of tracking 12 real microtubule seeds over 201 frames, and 15 simulated seeds, generated with similar imaging parameters to the real seeds, over 50 frames.
