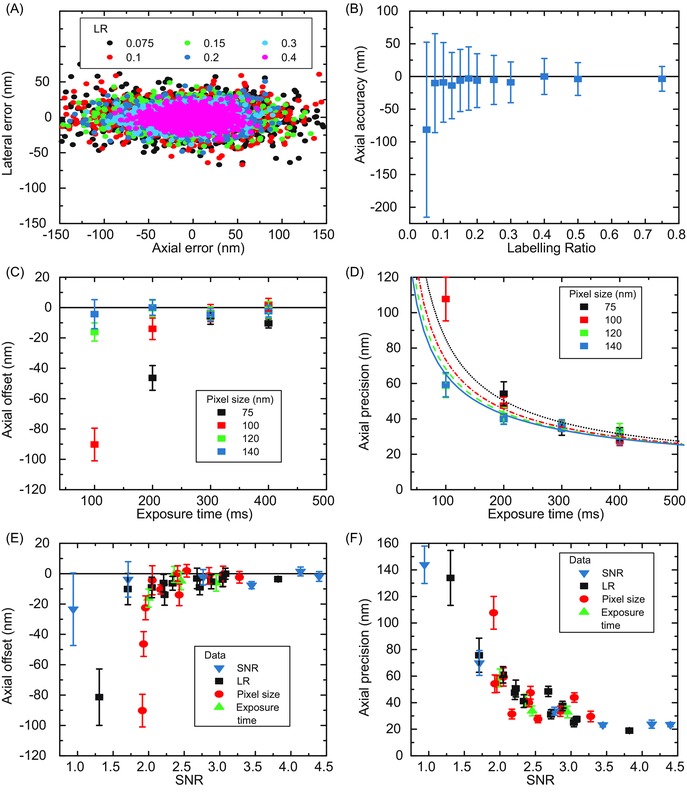
Figure 7.

Localization errors from tracking simulated growing microtubule ends for different labelling ratios, exposure times and pixel sizes. (A) Scatter plot of individual localization errors from tracking simulated microtubules with different labelling ratios (LR), as indicated. (B) Average axial offset for each data set in (A). Error bars are associated precision values. (C) Average axial offset for tracked microtubules simulated with different exposure times and pixel sizes. Error bars are from bootstrapping. (D) Average axial precision for the data sets in (C). Error bars are from bootstrapping. Lines indicate global fits to the data using Equation 17 in Thompson et al. (2002), where the detected photon number is assumed to be directly proportional to the exposure time, and an additional EMCCD multiplicative noise factor of 1.4 is included. The optical background and readout noise were determined as 0 and 0.5 respectively from the fit. (E, F) Summary of data from (A)–(D) showing the average axial offset (E) and precision (F), for simulated microtubules: for each data set the average SNR value has been determined from the first frame of the movie. Error bars are from bootstrapping. The labelling ratio, the exposure time and the pixel size were 0.2, 200 ms and 120 nm, respectively, when they were not varied. The growth velocity (vg), the end diffusion constant (Dp), the lateral displacement (σLD) and the taper length (TL) were kept always constant at 11 nm/s, 271 nm2/s, 150 nm and 96 nm, respectively. A summary of all results is given in Table S6.
