
Figure 1.
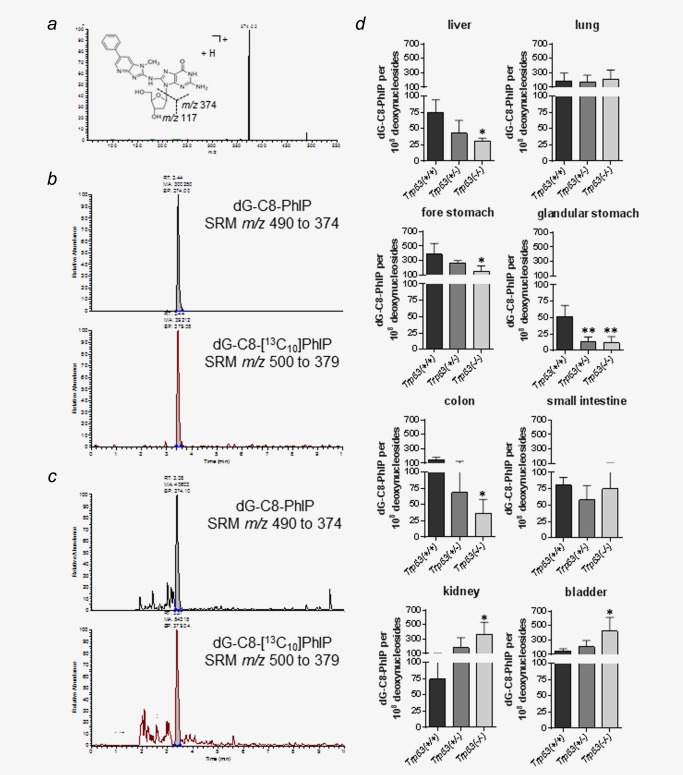
(a) Positive LC‐ESI‐MS/MS collision induced dissociation (CID) product ion spectrum of PhIP‐C8‐dG standard (1 ng/ml). The spectrum was acquired after continuous infusion at a flow rate of 10 μL/min with a syringe pump. Typical LC‐MS/MS SRM ion chromatograms for the determination of PhIP‐C8‐dG in (b) a mixture of PhIP‐C8‐dG standard (1 ng/ml) and 0.49 ng (1000 fmol) of [13C10]PhIP‐C8‐dG internal standard on column and in (c) 50 μg liver DNA isolated from Trp53(+/+) mice treated with 50 mg/kg bw PhIP and 0.49 ng (1000 fmol) of [13C10]PhIP‐C8‐dG internal standard on column. The SRM transitions monitored were m/z 490 to 374 for PhIP‐C8‐dG and m/z 500 to 379 for [13C10]PhIP‐C8‐dG. The analytical column was eluted isocratically at a flow rate of 200 μL/min with water/acetonitrile (0.1% formic acid) (85:15, v/v). (d) Quantitative LC‐ESI‐MS/MS analysis of PhIP‐C8‐dG in various tissues of Trp53(+/+), Trp53(+/−) and Trp53(−/−) mice after exposure to PhIP. Values are the mean ± SD (n = 4). Statistical analysis was performed by one‐way ANOVA followed by Tukey post‐hoc test (*p < 0.05, **p < 0.01; different from Trp53(+/+) mice). [Color figure can be viewed in the online issue, which is available at wileyonlinelibrary.com.]