
Figure 2.
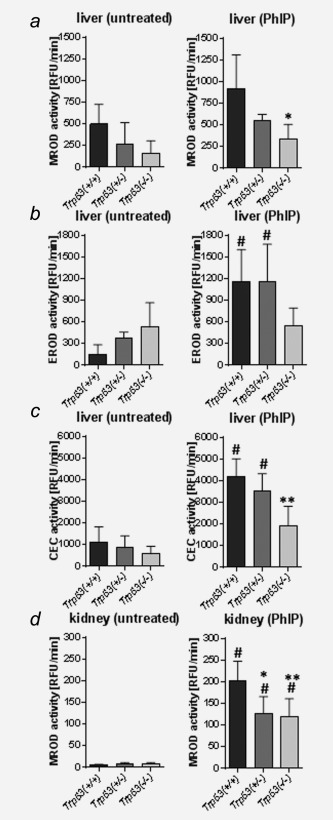
Measurement of microsomal enzymes metabolising PhIP in the livers and kidneys isolated from Trp53(+/+), Trp53(+/−) and Trp53(−/−) mice. Cyp1a enzyme activity was measured as (a) MROD, (b) EROD as well as (c) CEC activity in hepatic microsomes and (d) MROD activity in renal microsomes isolated from control (untreated) mice (left panel) or mice treated with PhIP (right panel). Values are the mean ± SD of three independent determinations; 4 animals per genotype were analysed in three separate experiments. RFU, relative fluorescence unit. Statistical analysis was performed by one‐way ANOVA followed by Tukey post‐hoc test (# p < 0.05, versus control [untreated] mice; *p < 0.05, **p < 0.01, different from PhIP‐treated Trp53(+/+) mice).