Figure 2.

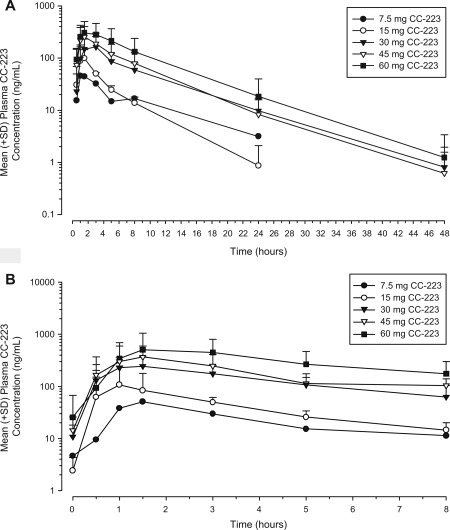
Mean (+standard deviation [SD]) plasma concentration‐time profiles of CC‐223 are presented on semi‐log scale on (A) day −1 after single dose and (B) day 15 after multiple doses.

Mean (+standard deviation [SD]) plasma concentration‐time profiles of CC‐223 are presented on semi‐log scale on (A) day −1 after single dose and (B) day 15 after multiple doses.