
Figure 1.
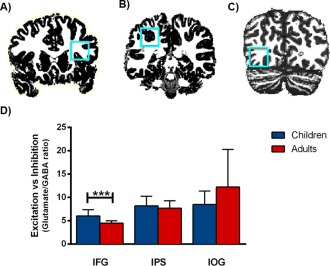
Cortical glutamate/GABA ratios in the child and adult brain per region. 1H‐MRS voxel (2x2x2cm) positions for (A) inferior frontal gyrus (IFG), (B) intraparietal sulcus (IPS), and (C) inferior occipital gyrus (IOG) are shown on coronal slices. D: Total quantities of the normalized glutamate/GABA ratios in the IFG, IPS, and IOG. Children showed significantly higher relative excitation levels than adults in the IFG. *** P <0.001. [Color figure can be viewed in the online issue, which is available at http://wileyonlinelibrary.com.]