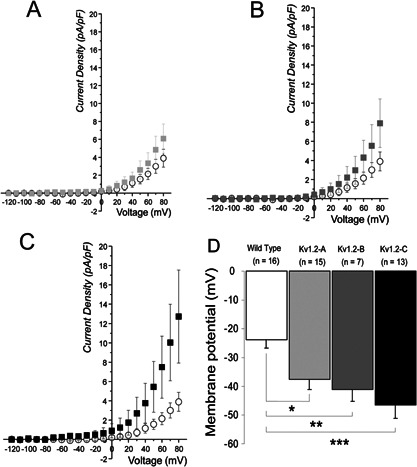
Figure 2.

Currents and membrane potential of Kv1.2 Clones recorded in conventional whole‐cell configuration. A–C: mean current densities (pA.pF−1) comparison of transmembrane outward currents in COS‐7 WT cells (n = 8), against low (A: Kv1.2‐A, n = 6), medium (B: Kv1.2‐B, n = 5), and high (C: Kv1.2‐C, n = 11) level of Kv1.2 channel expression, respectively. D: diagram of mean membrane potential (mV) of WT COS‐7 cells compared to low, medium and high level of Kv1.2 channel expression (Kv1.2‐A, B, and C). *P < 0.005, ** P < 0.003, ***P < 0.0003. Mean ± SE.
