
Figure 2.
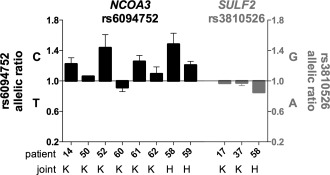
Allelic expression analysis in cartilage samples from osteoarthritis (OA) patients. Allelic expression was assessed using the transcript single‐nucleotide polymorphisms rs6094752 in NCOA3 (black bars) and rs3810526 in SULF2 (gray‐shaded bars). Allelic expression of cDNA was normalized to that of its corresponding DNA. Data are presented as a ratio of expression of the major allele over that of the minor allele; thus, a value above 1 means that there is more of the major allele. Samples are grouped according to OA joint site (knee [K] or hip [H]), with the numbers of patients shown. Bars show the mean ± SEM.