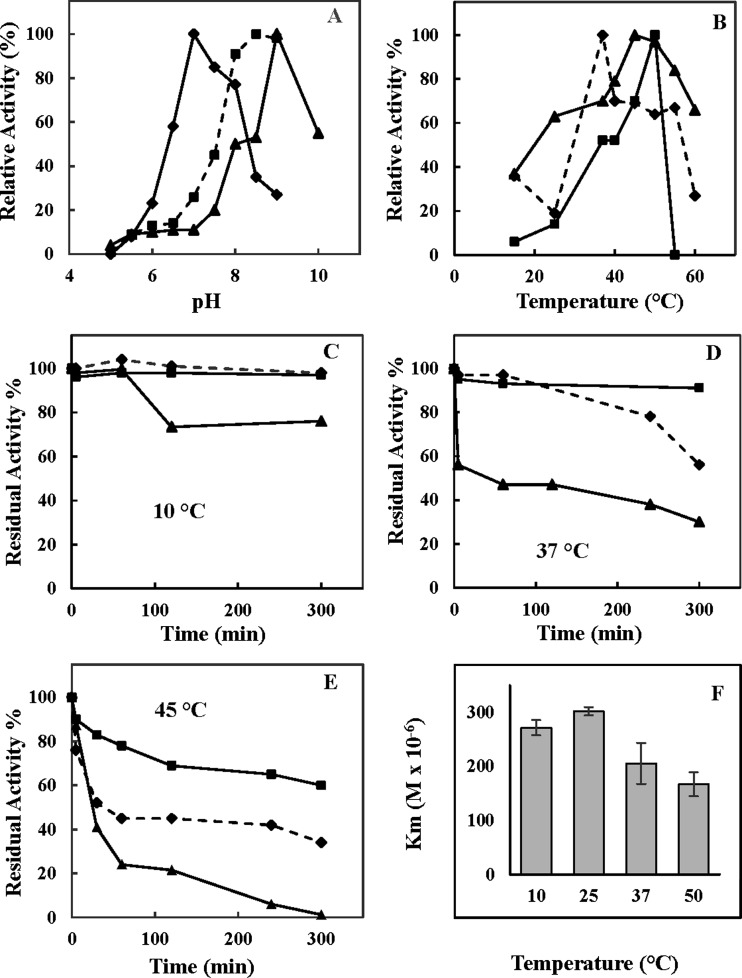
Figure 4. Molecular properties of the purified T. bernacchii 26S proteasome.
(A) pH and (B) temperature effects on the proteasome activities. Relative activity was expressed as percentage of the corresponding maximal activities. (C–E) thermoresistance of 26S isoform at: (C) 10°C, (D) 37°C, (E) 45°C; (F) temperature–Km profile of T. bernacchii 26S proteasome, using LLVY as substrate. T-like, CT-like and PGPH-like activities are indicated by square, triangle and diamond respectively. All experiments were performed in triplicate on three different protein preparations. Data were expressed as means ± standard deviations. Standard deviation values lower than 5% were not shown

