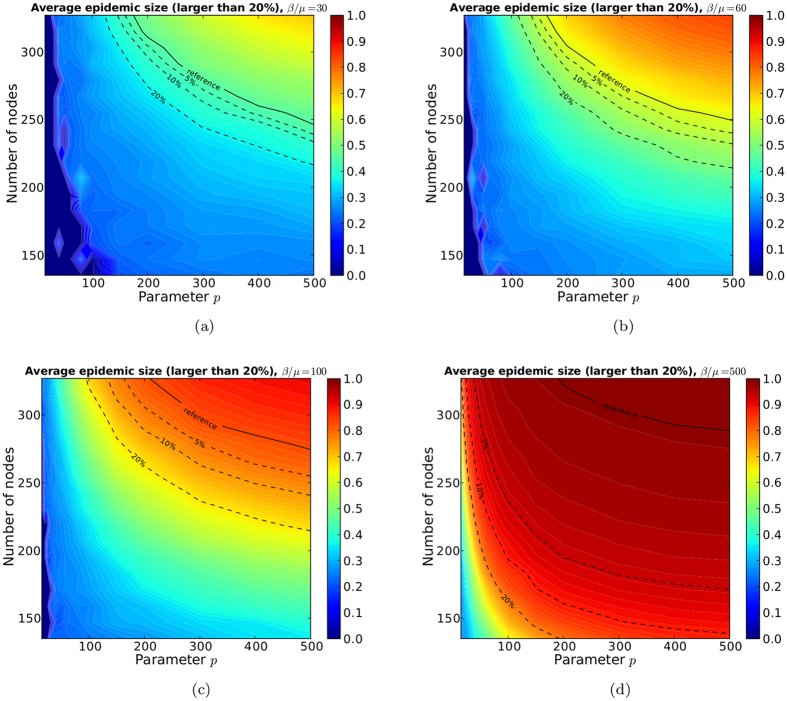
Figure 8. Color maps of the average epidemic size for epidemics with size above 20% for several values of β/μ.
When no epidemics has size above 20%, the value is zero. The three dashed lines represent the value of average epidemic size at 5%, 10%, 20% of the reference value (solid line), which corresponds to the average epidemic size of the SIR spreading simulations performed on the contact network.

