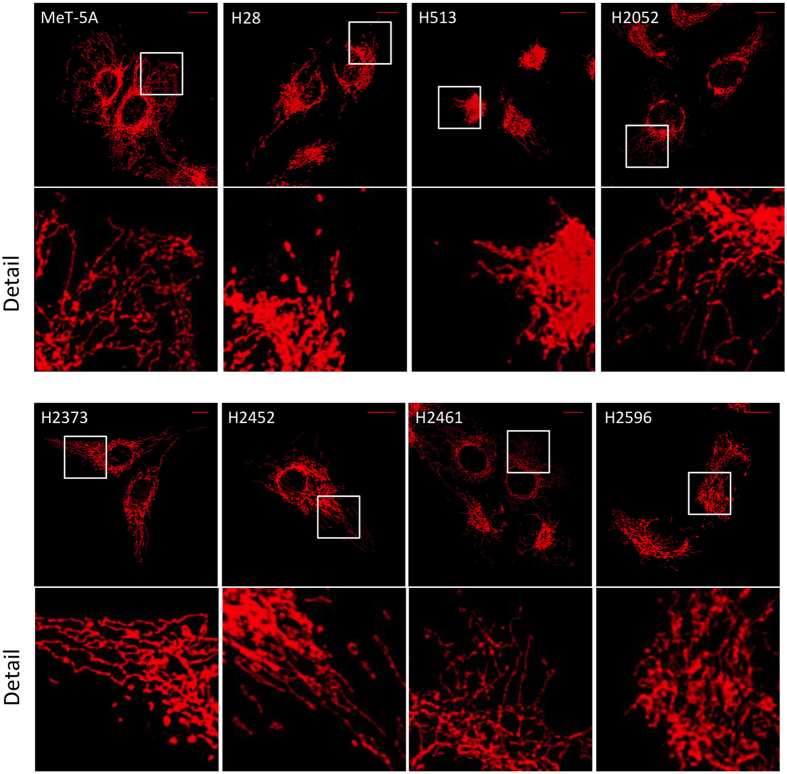
Figure 2. Mitochondrial morphology in malignant mesothelioma cell lines.
Mesothelioma cell lines were fixed in 4%paraformaldehyde and stained with TOM20 and Alexa647. Confocal Z-stack images were captured using a Leica SP5 II and a maximum projection image was generated using ImageJ. Scale bar shown is 10 μm. Detailed image from highlighted area is shown for each cell type.

