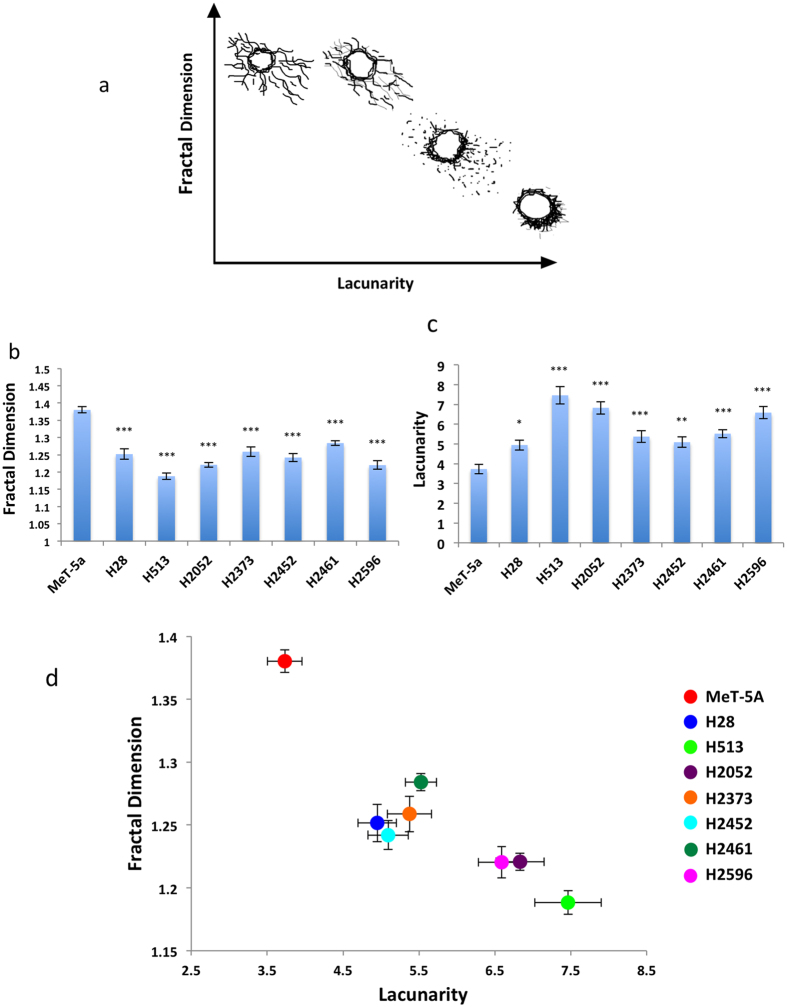
Figure 3. Fractal dimension and lacunarity of mitochondria.
(a)Examples of typical mitochondrial morphologies obsereved in mesothelial cell lines classified via fractal dimension and lacunarity. Maximum projection of Z-stack image series of TOM20 mitochondrial marker stain was used to quantify (b) mitochondrial fractal dimensions and (c) lacunarity. Images were converted to grayscale and analysed using the FracLac plugin from ImageJ. The entire mitochondria of each cell was analyzed. Data are presented as mean ± SEM, significance was calculated using an ANOVA with Tukey post test (*p < 0.05, **p < 0.005, ***p < 0.0001) n ≥ 40 for each cell type (c). (d) Profile of mesothelioma mitochondrial morphologies classified via fractal dimension and lacunarity.

