
Figure 6. Bioenergetic profile of malignant mesothelioma cell lines.
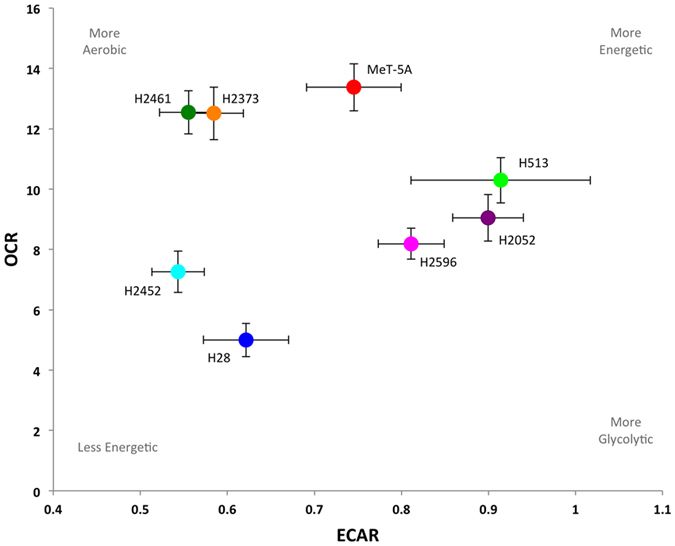
Plot of basal ECAR and OCR levels in mesothelioma and control cell lines, mean values ± SEM are shown. From the plot we can easily see that H28 and H2452 are the least energetic cell lines, while MeT-5A and H513 have relatively high levels of both oxidative phosphorylation and glycolysis and are therefore more energetic. H2461 and H2373 are more aerobic, while H2461 and H2596 are more glycolytic.