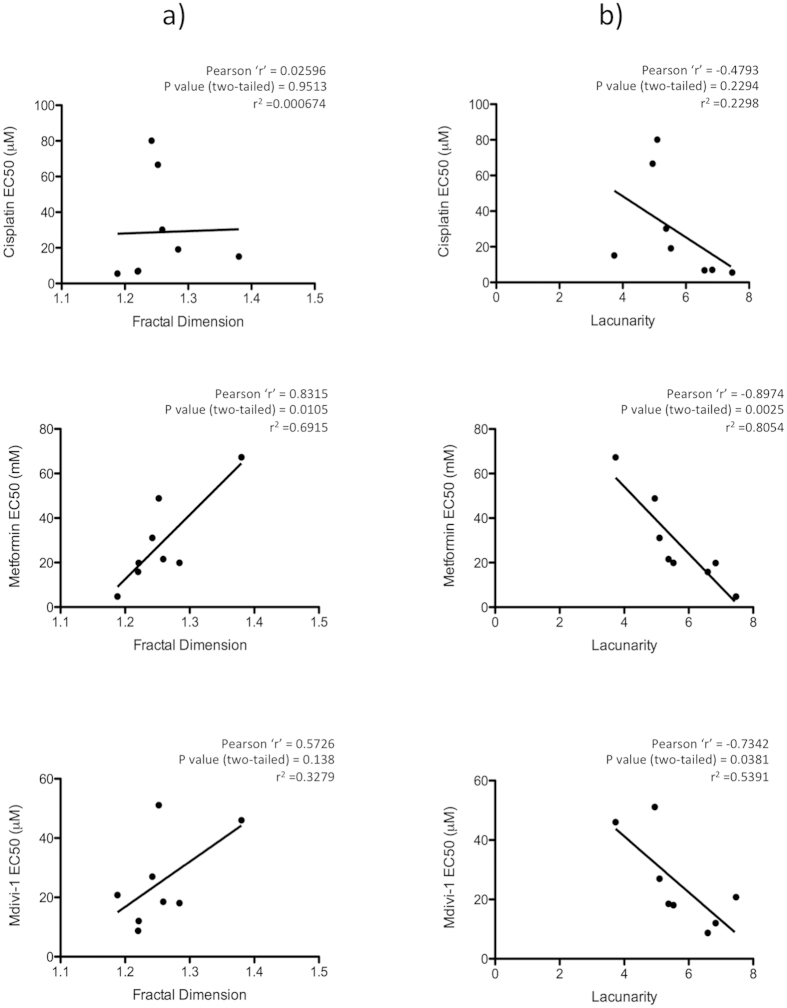
Figure 8. Correlation between EC50 and mitochondrial morphology.
Scatter plot sowing correlation between (a) Fractal dimension and (b) Lacunarity and inhibitor sensitivities (EC50 values) for cisplatin, metformin and mdivi-1. Significant correlation is observed between fractal dimension and metformin EC50 and between lacunarity and metformin and mdivi-1 EC50. Pearson correlation coefficient was calculated for each data pair as indicated.

