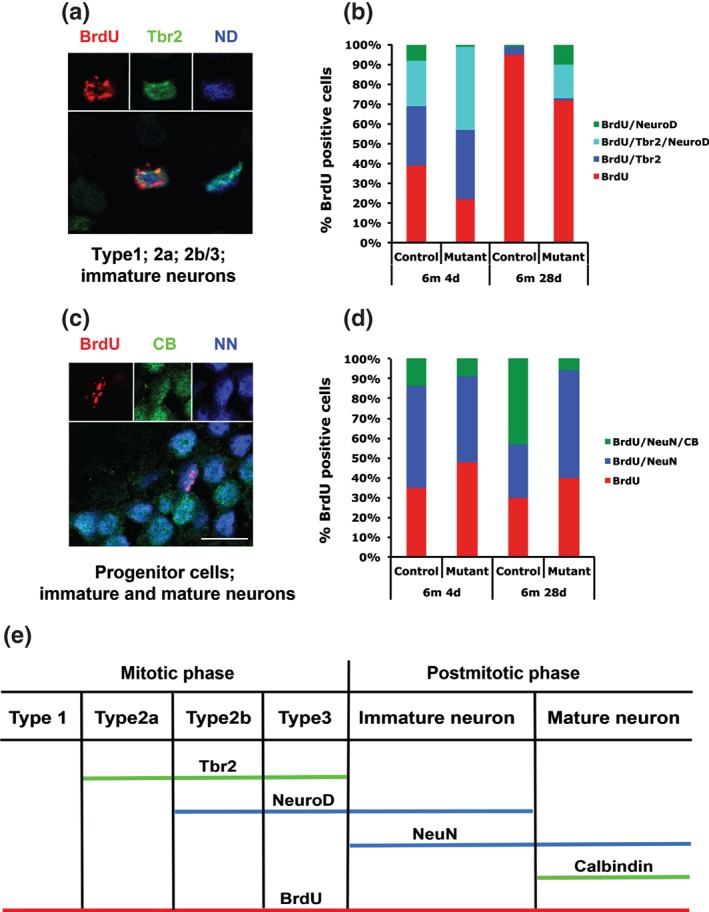
Figure 3.

Differentiation analysis of adult‐born granule cells. (a,c) Immunofluorescence staining of BrdU (red), Tbr2 (green) and NeuroD (blue) (a) as well as BrdU (red), CB (green) and NeuN (blue) (c) positive cells. Scale bar, 7.5 µm. (b,d) Schematic representation of the quantitative analysis of co‐localization of BrdU, Tbr2 and NeuroD (b) as well as BrdU, Calbindin and NeuN (d). n = 3; NN, NeuN; ND, NeuroD; CB, Calbindin. (e) Alignment of marker genes used to their respective differentiation stages.
