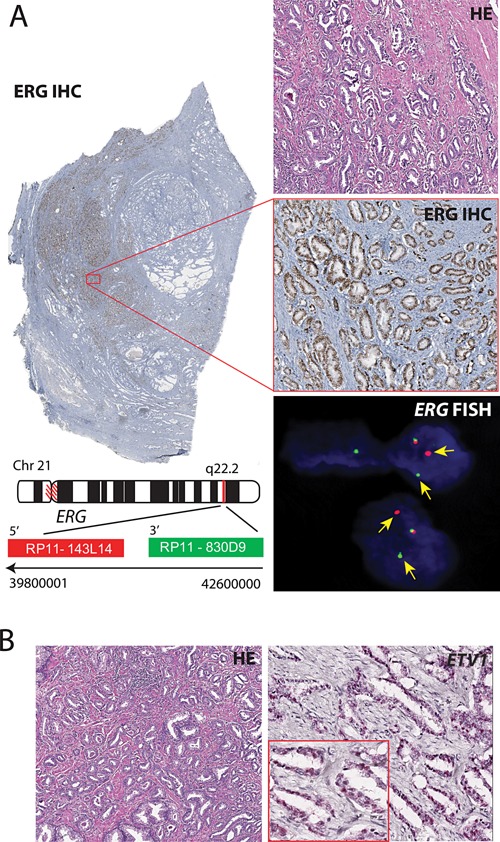
Figure 1.

IHC staining and FISH for ERG rearrangement and RNA‐ISH for ETV1. Panel A, whole section view of a prostate carcinoma tissue (Gleason score 3 + 3) showing ERG expression by IHC staining (panel on left). Right panel showing IHC staining for ERG over‐expression (×20 magnification) with the corresponding H&E stained sections (top). Bottom panel shows FISH for ERG genetic rearrangement using ERG break‐apart probes. Yellow arrow shows rearranged ERG, and co‐localizing red‐green signal depicts intact ERG locus. Panel B shows ETV1 expression by RNA‐ISH with a maximum intensity score 4 (×20 magnification).
