
Figure 3.
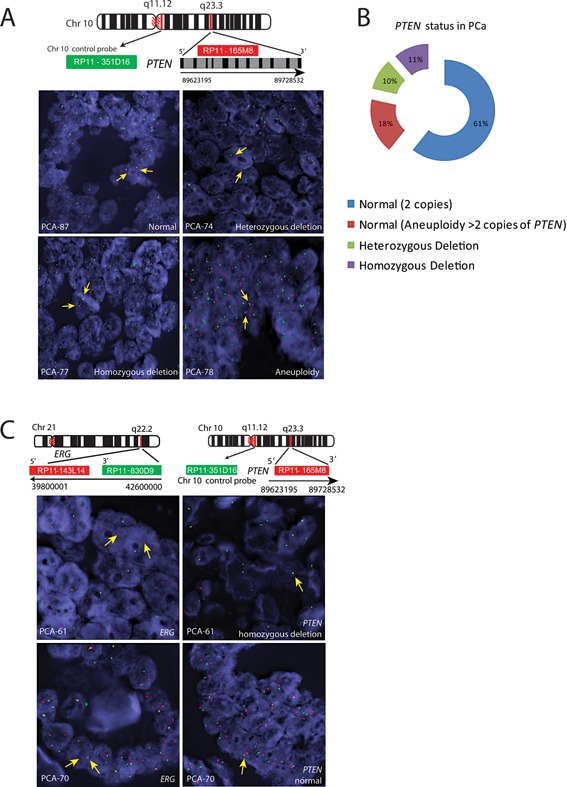
FISH for PTEN aberrations. Panel A, schematic diagram showing the genomic organization of PTEN gene on Chr10 q23.3 and chromosome 10 control probe (q11.12). Green and red bars indicate the chromosome 10 control probe and PTEN BAC clones, respectively. FISH images of the PCa specimens, PCA‐87 shows normal PTEN copy number with two red and two green signals corresponding to PTEN and Chr10 control probe, respectively. PCA‐74 shows heterozygous deletion of PTEN showing loss of one red signal, but two green centromere signals. PCA‐77 depicts homozygous deletion of PTEN (loss of red signals), but two green centromere signals. PCA‐78 shows aneuploidy with 3‐4 copies of chromosome 10 and PTEN. Panel B, percent distribution of the PTEN aberrations. Panel C shows ERG genetic rearrangement using ERG break‐apart probes and homozygous deletion of PTEN in the same patient (PCA‐61). Likewise, PCA‐70 shows ERG genetic rearrangement and normal PTEN status.