Figure 2.

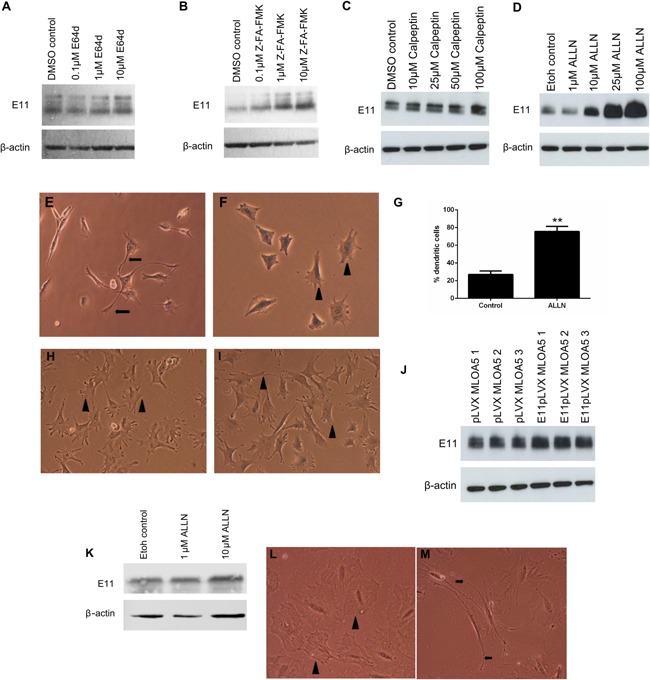
Western blotting of E11 protein (∼38 kDa) expression in MLO‐A5 cells treated with increasing concentrations of (A) E64d, (B) Z‐FA‐FMK, (C) Calpeptin, (D) ALLN, for 24 h. β‐actin was used as a loading control. Effect of ALLN treatment on MLO‐A5 cell morphology after 48 h with (E) 10 µM ALLN and (F) 0 µM ALLN treatment. Control cultures display numerous short cell projections (arrowheads, F) in comparison to treated cells which display multiple long, thin cytoplasmic cellular projections (arrows, E). (G) The percentage of MLO‐A5 cells expressing an elongated dendritic‐like morphology after treatment with ALLN in comparison to control cultures. Data are represented as mean ± S.E.M of three individual experiments. **P < 0.01 in comparison to control cultures. Effect of calpeptin treatment on MLO‐A5 cell morphology after 48 h with (H) 10 µM calpeptin (I) 10 µM calpeptin; both control and calpeptin‐treated cells displayed short, cell projections (arrowheads). (J) Overexpression of E11 in MLO‐A5 cells upon addition of 15 µM ALLN (E11pLVX) at day 0 for 24 h, in comparison to control cultures treated with 15 µM ALLN (pLVX). (K) Western blotting of E11 protein (∼38 kDa) expression in IDG‐SW3 cells treated with increasing concentrations of ALLN. Effect of ALLN treatment on IDG‐SW3 cell morphology after 48 h 10 µM ALLN treatment. Control cultures display numerous short cell projections (arrowheads, L) in comparison to treated cells which display multiple long, thin cytoplasmic cellular projections (arrows, M). β‐actin was used as a loading control.
