
Figure 5.
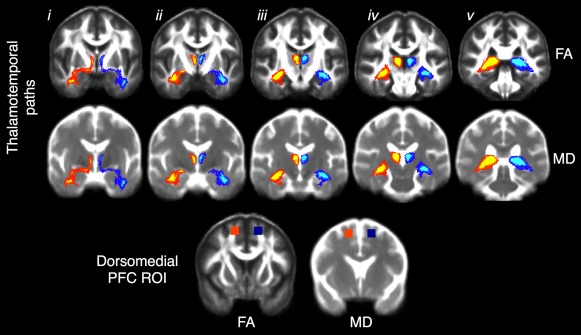
Diffusion tensor imaging probabilistic thalamotemporal paths projected onto mean fractional anisotropy (FA; top) and mean diffusivity (MD; middle) templates constructed from all patients and controls. These common paths were generated for visual purposes by averaging and thresholding (75%) the individual paths obtained from each participant in standard space. i–v indicate anterior to posterior coronal sections showing the ipsilateral (red–yellow) and contralateral (dark blue–light blue) thalamotemporal paths. The anterior sublenticular pathway can be seen in i, and the posterior fornical pathway can be seen in v. The bottom coronal sections show the control region in the dorsomedial prefrontal cortex (PFC) projected onto the same FA (left) and MD (right) template. ROI = region of interest. [Color figure can be viewed in the online issue, which is available at www.annalsofneurology.org.]