
Figure 1.
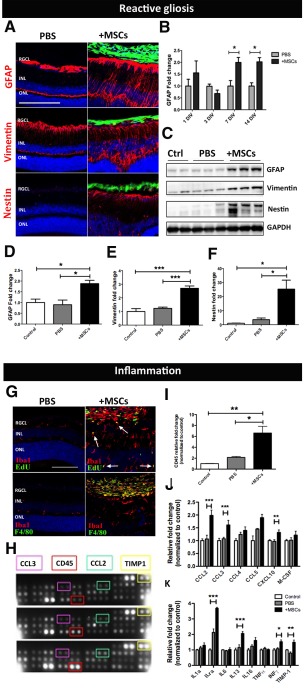
MSC transplantation induces reactive gliosis and inflammation in the recipient retina. (A): Immunostaining showing upregulation of the intermediate filaments (red) GFAP, Vimentin, and Nestin following transplantation. Scale bar = 200 µm. (B): Time course of GFAP protein expression in MSC recipient retinas relative to PBS sham injected retinas (n = 4, two‐way ANOVA). (C): Western blot and its quantification (D–F) confirming gliosis at 7 days post‐transplantation. (G): Immunolabeling for Edu and F4/80 (green) with the pan microglia marker Iba1 (red) showing microglia proliferation (white arrows) and macrophage recruitment in MSC recipient retina. Scale bar = 100 µm. (H–K): Proteome profiler array and its quantification (n = 4 per group). Black, gray, and white bars represent protein expression level in MSC recipient‐, PBS sham injected‐, and naïve control retina, respectively. Error bars represent SEM, *, p < .05, **, p < .01; ***, p < .001, one‐way ANOVA test with Tukey's correction. Abbreviations: GFAP, glial fibrillary acidic protein; INL, inner nuclear layer; MSC, mesenchymal stem cell; ONL, outer nuclear layer; PBS, phosphate buffered saline; RGCL, retinal ganglion cell layer.