
Figure 2.
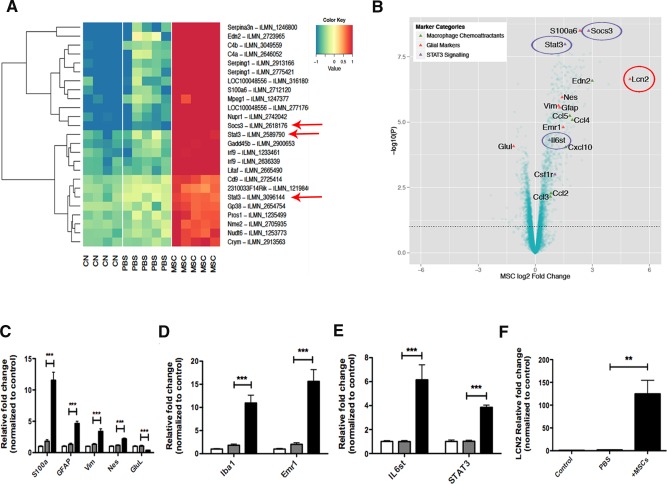
Microarray gene expression profiling of MSC recipient retina. (A): The top 25 probes showing the most significant changes in gene expression as ranked by ANOVA p‐value over the control (CN), sham (PBS), and MSC‐treated (MSC) groups. The expression levels of each probe across the three treatment groups are mean‐centered and are shown alongside the gene they map to. Red means high expression and blue means low expression compared to the average expression across the samples. Components of the STAT3 signaling are highlighted (red arrows). (B): Volcano plot showing key marker genes in retinal samples receiving MSC transplantation compared to PBS injected control groups. Key genes known to be markers of macrophage chemoattractant (green triangles), glial cells (red triangles), and STAT3 signaling (purple triangles) are highlighted. (C–F): Validation of the microarray data by qPCR. Error bars represent SEM, **, p < .01; ***, p < .001, one‐way ANOVA test with Tukey's correction. Abbreviations: CN, control; GFAP, glial fibrillary acidic protein; MSC, mesenchymal stem cell; PBS, phosphate buffered saline.