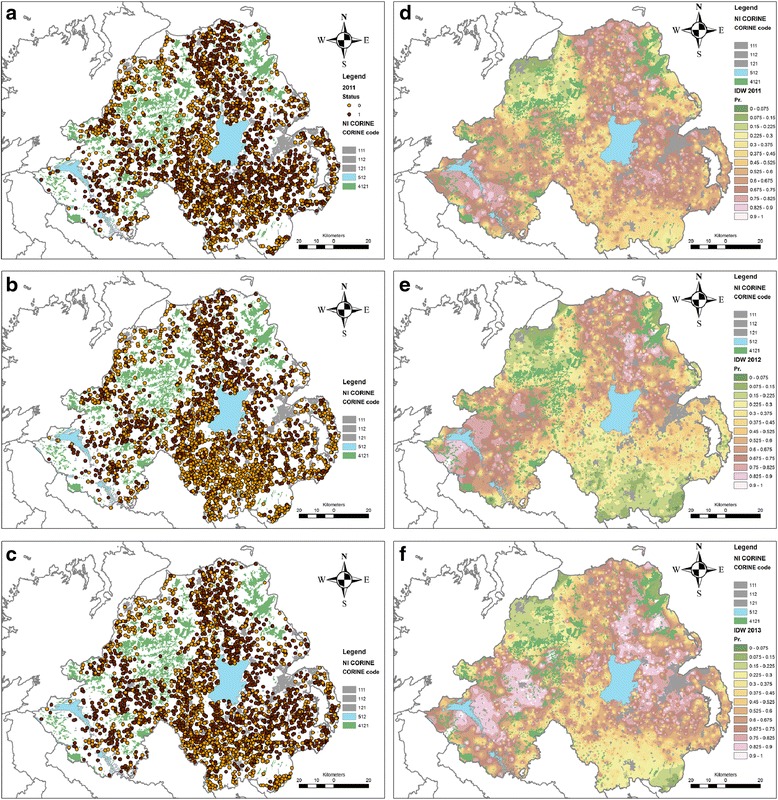
Fig. 2.

Observed and predicted within-herd liver fluke prevalence in Northern Ireland based on meat inspection data. Panels a-c depicts the distribution of herds with high or low within-herd infection prevalence for 2011–2013, respectively. Panels d-f represents predicted probability of a herd being in a high infection category from 2011–2013 from a logistic model, respectively. The CORINE land cover types presented in this map corresponds with: 111 = Continuous urban fabric; 112 = Discontinuous urban fabric; 121 = Industrial and commercial units; 512 = Water bodies; 4121 = Unexploited bogs
