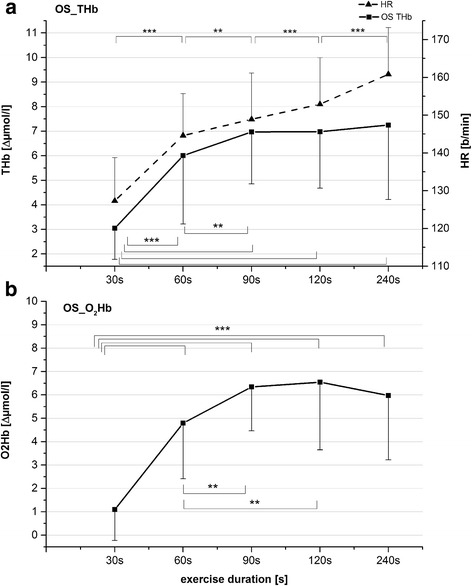
Fig. 4.

a Overshoot values of ΔTHb (solid line) and end-exercise (EE) heart rate values (broken line) (mean ± SD) after the five exercise bouts. b Overshoot values of ΔO2Hb (mean ± SD) after five exercise bouts. Asterisks represent results from post-hoc tests in relation to values marked with double lines; * P < 0.05; ** P < 0.01; *** P < 0.001. Heart-rate values all differed significantly from each other at P < 0.001
