Fig. 2.

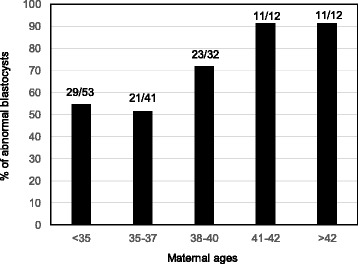
Abnormal day 7 blastocysts formation in patients at various maternal ages. Numbers in the top of each bar indicate the numbers of aneuploid blastocysts vs total number of blastocysts biopsied and screened

Abnormal day 7 blastocysts formation in patients at various maternal ages. Numbers in the top of each bar indicate the numbers of aneuploid blastocysts vs total number of blastocysts biopsied and screened