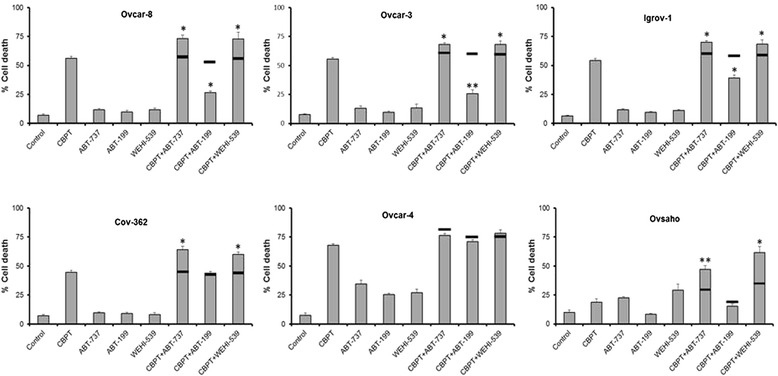
Fig. 3.

The effect of BH3 mimetic combinations on cell viability. The indicated cells were treated for 48 h (24 h for Ovcar-4) with carboplatin (66 μM), the indicated BH3 mimetic (concentraions are described in Methods) or a combination of the drugs as shown. Cells were stained with trypan blue and the percentage of dead cells determined by microscopy. Data are expressed as the fraction of viable cells measured in cells treated with drug vehicle (mean ± SD, n = 3). The horizontal solid lines on the bar chart indicate the expected effect of the combination calculated using the Bliss independent effect and the effect of the single agents. Experimental results are significantly different from Bliss expected effect where indicated (*P ≤ 0.05 and **P ≤ 0.01, paired t-test)
