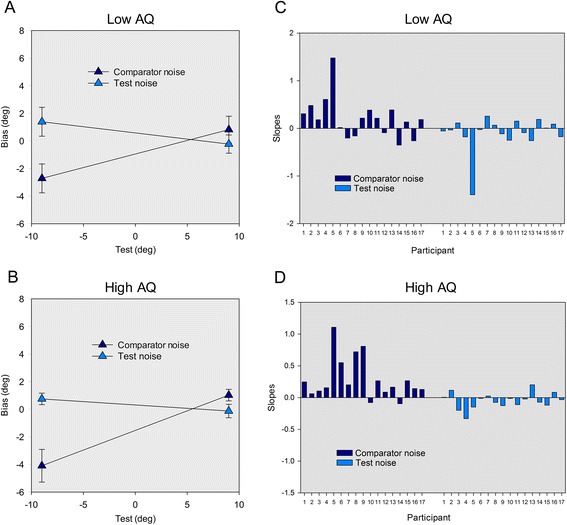
Fig. 2.

Experiment 1. Average bias scores for (a) the low AQ group and (b) the high AQ group when the test contained noise (filled diamonds) and when the comparator contained noise (crossed diamonds) at each test deviations −9° and 9°. Individual slopes of the biases for all participants in the (c) low AQ group and (d) the high AQ group when the test contained noise (filled bars) and when the comparator contained noise (crossed bars)
