Figure 2.

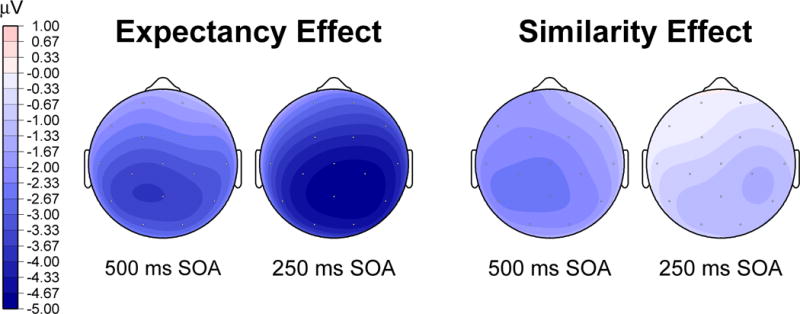
Topographic maps (based on spherical spline interpolation) of the expectancy effect and the similarity effect in each SOA condition show a medial central-parietal distribution typical of the N400.

Topographic maps (based on spherical spline interpolation) of the expectancy effect and the similarity effect in each SOA condition show a medial central-parietal distribution typical of the N400.